Supplementary Material
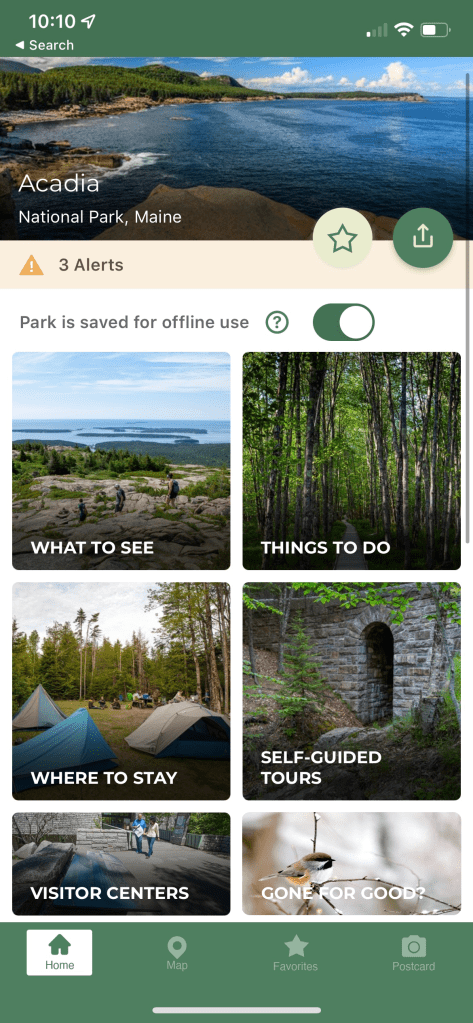
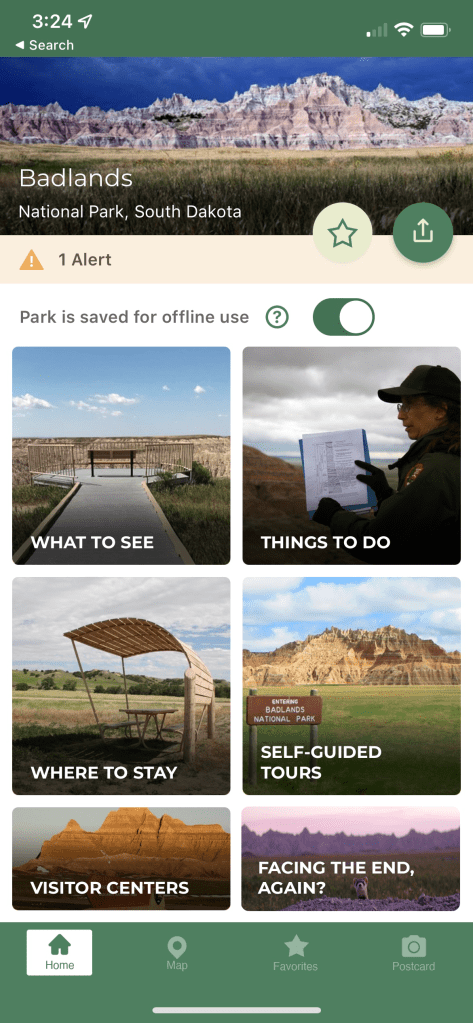
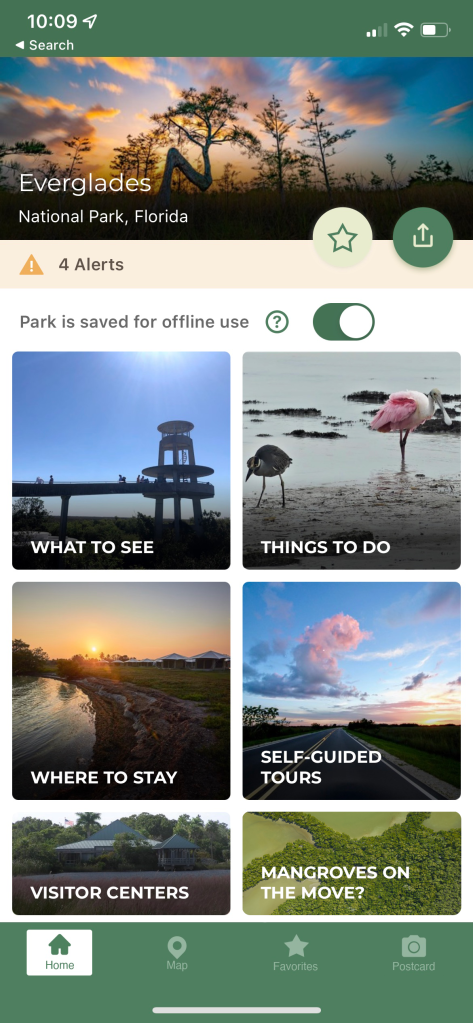
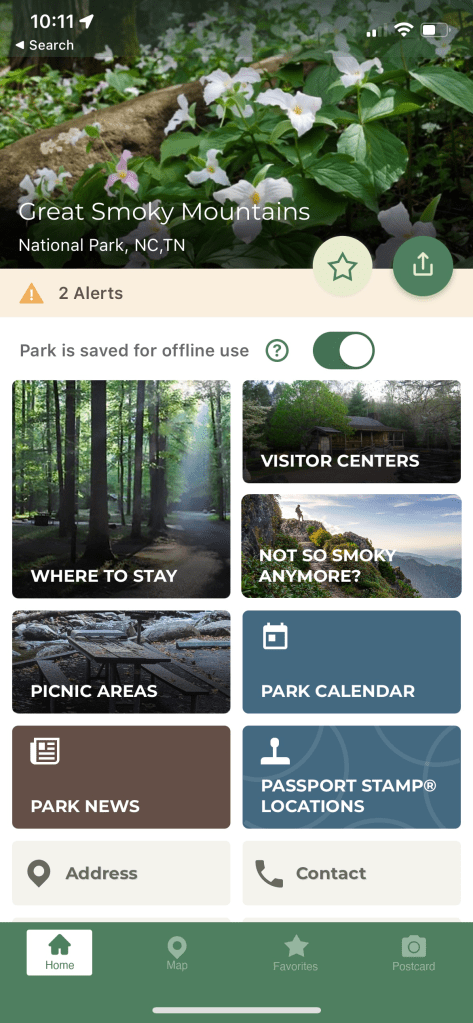
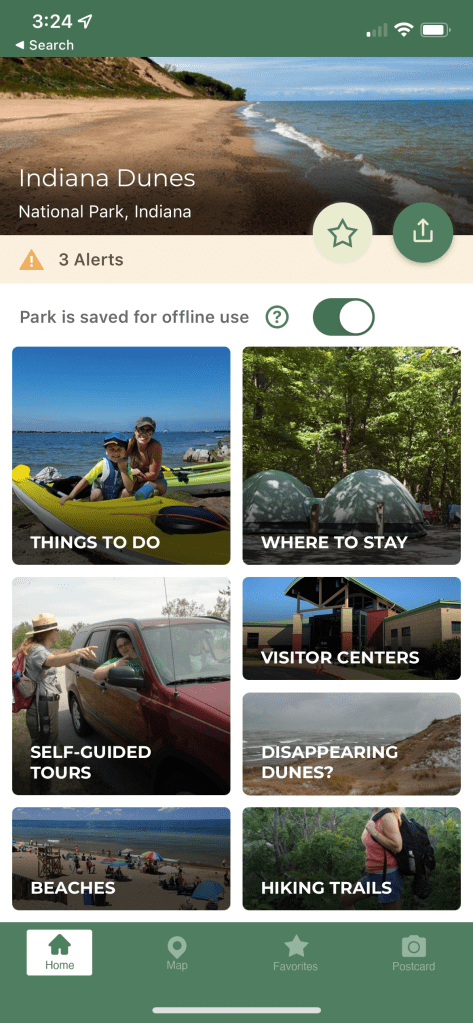
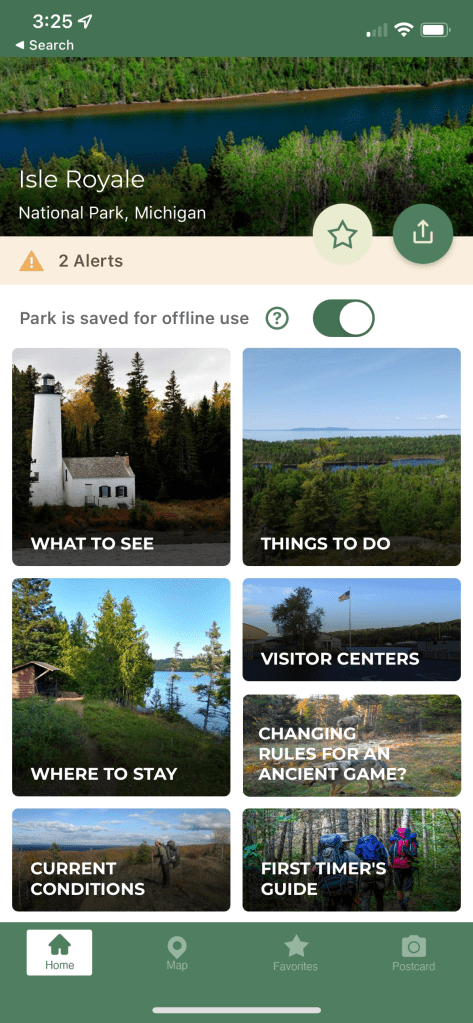
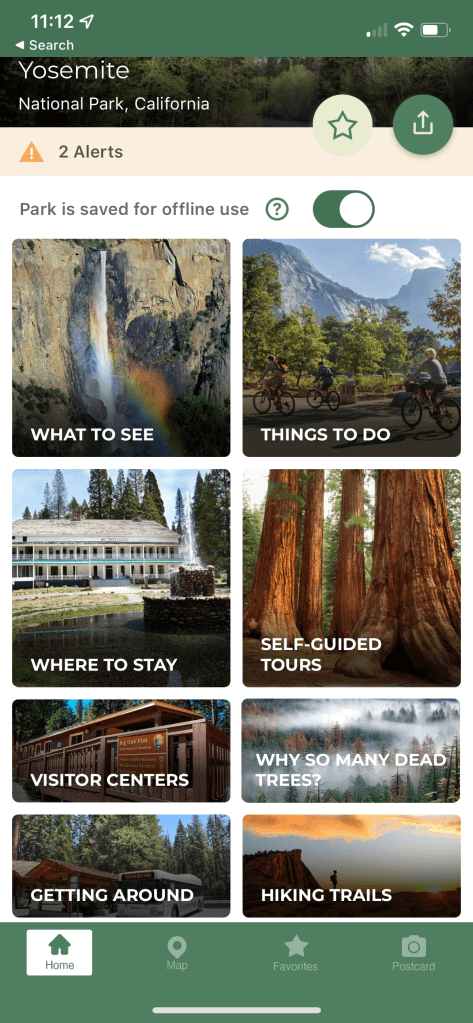
NPS APP MOCK-UPS – NOT FOR DISTRIBUTION
Click image for link to existing park-specific climate change information


References
- National Park Service. 2023. “Visitation numbers.” https://www.nps.gov/aboutus/visitation-numbers.htm
- See Appendix A.1
- Lahr, K.E. 2017. “This is what I’ve seen”: “Climate change communication and the articulation of local and scientific knowledge in Yosemite National Park.” Master’s thesis, University of Utah. https://collections.lib.utah.edu/ark:/87278/s6x392tx
- Environmental Data and Governance Initiative (EDGI). 2018. “Changing the digital climate: How climate change web content is being censored under the Trump administration.” https://envirodatagov.org/wp-content/uploads/2018/01/Part-3-Changing-the-Digital-Climate.pdf
- Boyd, R.L., A. Ashokkumar, S. Seraj, and J.W. Pennebaker. 2022. The development and psychometric properties of LIWC-22. The University of Texas at Austin. https://www.liwc.app
- Giaccardi, S., A. Rogers, and E.L. Rosenthal. 2022. “A glaring absence: The climate crisis is virtually nonexistent in scripted entertainment.” USC Norman Lear Center Media Impact Project. https://learcenter.org/wp-content/uploads/2022/10/GlaringAbsence_NormanLearCenter.pdf
- Shah, M., S. Seraj, and J.W. Pennebaker. 2021. Climate denial fuels climate change discussions more than local climate-related disasters. Frontiers in Psychology 12: 1-5. https://doi.org/10.3389/fpsyg.2021.682057
- Leiserowitz, A., E. Maibach, S. Rosenthal, J. Kotcher, L. Neyens, J. Marlon, J. Carman, K. Lacroix, and M. Goldberg. 2022. “Global Warming’s Six Americas, September 2021.” Yale University and George Mason University. New Haven, CT: Yale Program on Climate Change Communication. https://climatecommunication.yale.edu/publications/global-warmings-six-americas-september-2021/
- Schweizer, S., S. Davis, and J.L. Thompson. 2013. Changing the conversation about climate change: A theoretical framework for place-based climate engagement. Environmental Communication 7 (1): 42-62. http://dx.doi.org/10.1080/17524032.2012.753634
LIWC DICTIONARY
reducing our carb*
biodiversity
carbon capture
carbon emission*
carbon footprint*
carbon neutral
carbon tax*
care about the planet
ch4 emission*
ch4 level*
changing climate
clean energy
climate ch*
climate disaster*
climate emergency
climate justice
climate migration
climate refugee*
climate science
climate solution*
climate warming
co2 emission*
co2 level*
decreasing snow*
deforestation
drier summer*
dying planet
el nino
energy efficient
fossil fuel*
fracking
global warming
gone ext*
green energy
greenhouse effect
greenhouse gas*
hotter summer
ice caps
increasing temp*
melting glaciers
melting ice c*
microplastic*
ocean pollution
ozone layer
plastic pollution
reduce emission*
reduce footprint*
reducing essential habitat*
reforestation
renewable energy
save the planet
sea level r*
sixth ex*
solar energy
solar panel*
sustainability
wind energyMISSING AUDIENCE MODELING
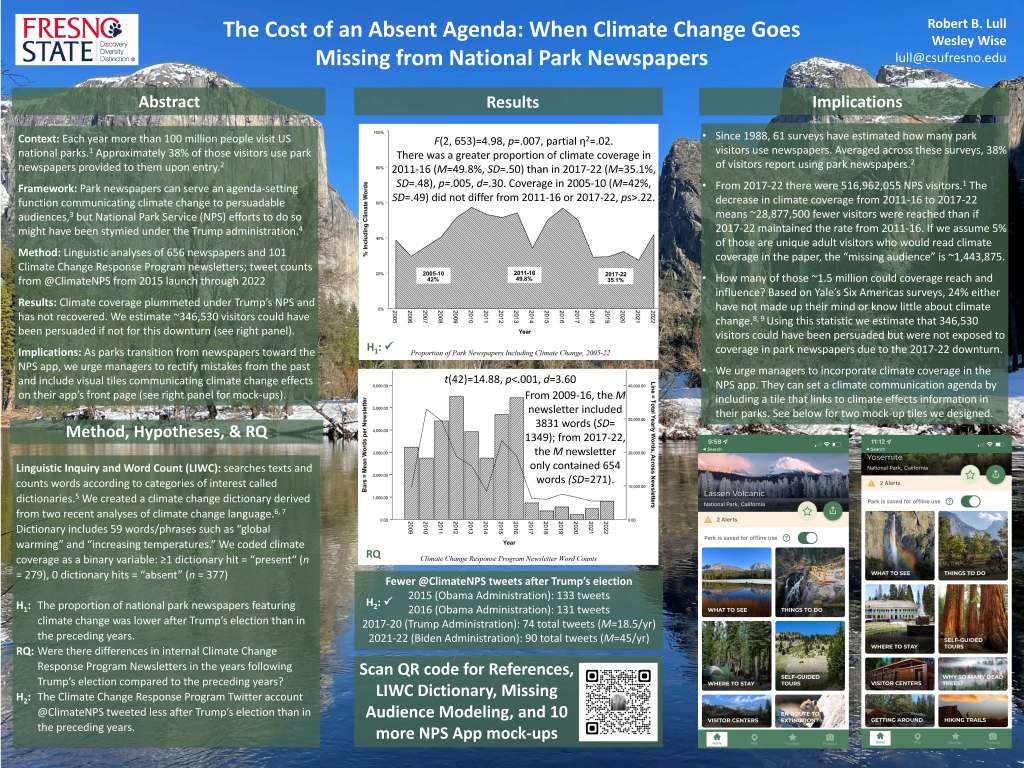
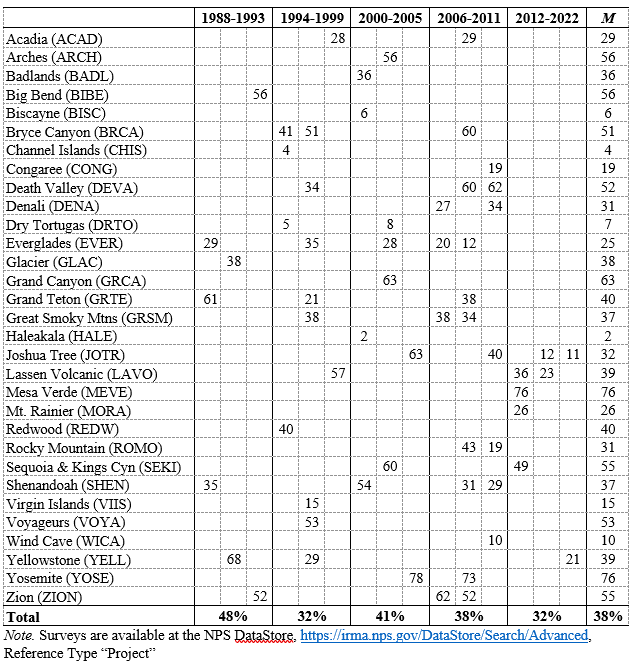
It is possible to estimate how big an audience the Park Service could have reached if 2017-22 climate coverage (35.1%) met the standard set from 2011-16 (49.8%). We can estimate this missing audience with statistical modeling based on visitor use studies. Since 1988, these studies have been conducted independently from NPS by university researchers using valid social scientific survey techniques. 61 such studies have asked visitors if they used park newspapers during their visit. Responses vary from seldom-visited island parks lacking entrance gates (e.g., Channel Islands, 4% of visitors) to global destinations where most visitors reported using the paper (e.g., Yosemite, 76% of visitors). Averaged across these 61 studies, 38% of visitors report using park newspapers (see Appendix A.1).
There are more sophisticated and granular ways to estimate the missing audience, but back-of-the-envelope calculations are efficient and appropriate in this research context.[1] We know from official statistics that there were 516,962,055 park visitors from 2017-22 (National Park Service 2023). If, as in 2011-16, 49.8% of 2017-22 newspapers featured climate coverage and 38% of park visitors reported using newspapers, then newspaper climate coverage had a potential audience of 97,829,899 park visitors. However, only 35.1% of 2017-22 newspapers actually featured climate coverage, reducing that potential audience by 29.5% to 68,952,399 and creating a missing audience of 28,877,500. We can then liberally discount the size of that missing audience with a fudge factor; for demonstration purposes, we will assume that only 5% of those who used the newspaper are 1) unique adult visitors who 2) would read climate coverage, reducing the missing audience to 1,443,875.
Of course, it is likely that most of this missing audience already has some opinion on climate change, so we need to add one more crucial factor to determine what we call the missing effective audience, or those who climate communication could reach and influence. We use projections based on the 2021 Yale Program on Climate Change Communication’s Six Americas survey (Leiserowitz et al. 2022) and a 2011 Six Americas survey of 3,233 national park visitors (Davis and Thompson 2020, 66) to estimate 24% belong to either the cautious group that has not yet made up their mind about climate change or to the disengaged group that knows little about climate change and rarely hears about it. This yields a final missing effective audience of 346,530 visitors who could have been persuaded about climate change but were not exposed to coverage in park newspapers. In other words, if 2017-22 park newspapers simply met the standard set from 2011-16, climate coverage could have reached an additional persuadable audience the size of the population of Anaheim, CA during that six-year period.
[1] It is possible that more granular approaches would increase the estimated missing audience because there is a positive correlation between park visitation and newspaper use as demonstrated in Appendix A.2.
APPENDIX A.1
Park Surveys Summary, Percentage of Visitors Using Newspaper
APPENDIX A.2
Park Surveys Scatterplot, Visitation Ranking by Average Percentage of Visitors Using Park Newspaper

